Product comparison chart design
Learn how to design a product comparison chart or table: choosing options and criteria, table layout, visual hierarchy, and making a shortlist easy to read.
Contents
- What a product comparison chart should do
- Choosing the options and criteria to include
- Choosing the table layout and orientation
- Using visual hierarchy to show what matters
- Formatting values so they compare cleanly
- Alternative formats when a grid gets crowded
- Making the chart work on small screens
- Checking the chart before you decide
- Questions about product comparison charts
- What should a product comparison table include?
- How many products should a comparison chart show?
- Should products go in columns or rows?
- What is the difference between a feature matrix and a comparison chart?
- Can I build a comparison chart in a spreadsheet?
Product comparison chart design is the craft of placing several options and their details in one readable grid. A clear chart keeps the option list short and ties each criterion to your decision. Visual hierarchy then makes the real differences easier to spot than the shared features.
- Compare a small set of options, and drop any that fail a must-have.
- Pick criteria from your own needs, not from the longest specification sheet available.
- Put options in columns and criteria in rows when you have few options.
- Use one consistent unit and format per row so values compare directly.
- Highlight differences and fade or hide rows where every option is the same.
What a product comparison chart should do
A product comparison chart exists to make one decision easier, not to store every fact you found. The chart puts options side by side, so you can read across a row to see differences. When a detail does not change your choice, it adds noise without adding help.
Start a comparison chart by writing down the single question it must answer. A question such as 'which laptop fits travel and video editing' shapes every later choice. The question decides which options belong, which criteria matter, and how the grid is ordered.
A comparison chart built for your own shortlist can be plainer than a marketing chart. Marketing charts tend to favor one product with color, badges and selective rows. Your own chart should treat each option the same way, so the layout does not tilt the result.
Choosing the options and criteria to include
The options in a comparison chart should already pass your must-have requirements. A must-have is a condition that rules an option out if it is missing, like a size limit. Filter on those first, then compare only the options that survive. A chart with a handful of columns stays readable on one screen.
Criteria are the chart rows, and each should connect to how you will use the product. Copying every line of a specification sheet produces a long grid where the useful rows get lost. Ask of each criterion whether a different value would change your decision. If the answer is no, leave that row out or move it to notes.
Each value in a comparison chart should come from a source you can check again later. A short source note, such as the listing page or a seller reply, keeps facts traceable. Mark guessed or unconfirmed values clearly so they do not pass for facts.
Choosing the table layout and orientation
Product comparison table design starts with orientation, meaning which items run across and which run down. Placing options in columns and criteria in rows suits a short list of options. Reading across one row then shows how every option handles the same criterion.
Flipping the table layout, with options as rows, works better when you compare many options on few criteria. Rows can grow downward without limit, while columns quickly run off the side of a screen. A flipped layout also lets you sort options by a single column, such as weight.
The first column of a comparison table works as an anchor and should hold short criterion names. Keep that column and the header row fixed, often called freezing, so labels stay visible while scrolling. Group related rows under short section labels, such as size, performance and costs.
| Layout | Suits | Watch for |
|---|---|---|
| Options as columns | A few options with many criteria | Width on small screens |
| Options as rows | Many options with few criteria | Fewer criteria visible at once |
| Option cards | A very short list read on a phone | Weaker side-by-side reading |
Using visual hierarchy to show what matters
Visual hierarchy is the order in which the eye notices parts of a chart. Size, font weight, contrast and position together decide what a reader sees first. In a comparison chart, option names and decisive criteria deserve the strongest emphasis.
Highlighting differences in a comparison chart works better than highlighting every value. A light background on cells that differ from the rest draws attention to real trade-offs. Rows where every option matches can be faded, collapsed or hidden behind a toggle.
Color in a comparison chart should carry one meaning, not serve as decoration. Pair any color with a symbol or word, since some readers cannot tell certain colors apart. Plenty of white space and thin row dividers keep a dense grid readable.
Formatting values so they compare cleanly
Values in one row of a comparison chart should share the same unit and format. Mixing inches with centimeters in one row forces mental conversion and invites errors. Keep decimal places consistent so values of similar size look similar.
Checkmarks suit yes-or-no features, while numbers suit anything you can measure. Turning a measurable value into a checkmark hides how much better one option is. Short text works for qualities that resist measurement, like a noisy fan or a stiff hinge. Keep such notes to a few words so the row stays scannable.
Missing data in a comparison chart needs its own clear marker, separate from 'no'. An empty cell could mean unknown, not applicable or absent. Readers cannot tell which meaning applies unless the chart says so. Distinct labels such as 'unknown' or 'not offered' remove the doubt, with a short legend below.
Alternative formats when a grid gets crowded
A feature matrix, the classic grid of options against features, is not the only comparison format. A weighted scorecard gives each criterion an importance weight, then totals a score per option. The total helps rank options, but the individual rows should stay visible beside it.
Option cards place each product in its own box with the same fields in the same order. Cards read well on a phone because they stack vertically instead of spreading sideways. The cost is weaker side-by-side reading, so cards suit a very short final shortlist.
A pros-and-cons layout lists the strengths and weaknesses of each option in two short columns. The format captures judgments a grid cannot hold, such as how a product feels in use. Pairing a pros-and-cons layout with a compact feature matrix keeps hard facts and impressions apart.
Making the chart work on small screens
A wide comparison chart breaks on small screens unless the design plans for it. Horizontal scrolling with a frozen first column keeps criterion names in view. Letting readers pick a few options to compare at once also narrows the grid.
Collapsible sections help a long comparison chart fit a phone without dropping detail. Show the decisive criteria open by default and fold secondary groups behind their labels. Section labels should stay tappable and large enough to hit with a thumb.
Text size in a mobile comparison chart should stay readable without zooming in. Shorten labels and values rather than shrinking the font to squeeze columns in. Abbreviations are fine when a legend or a tooltip, a small pop-up note, spells them out.
Checking the chart before you decide
A finished comparison chart deserves a quick test against the question it was built to answer. Glance at the grid briefly and note which option stands out first. If that option stands out because of styling rather than values, the hierarchy needs work.
Accuracy checks matter as much as visual checks in a comparison chart. Compare each cell against its source and confirm units match across the row. Listings change, so recheck prices and stock on any finalist before buying.
A second reader is a useful test of whether the chart explains itself. Ask someone to name the leading option and say why, without your help. Confusion over a label or symbol points to a spot that needs a clearer legend.
- Restate the question the chart answers
- Remove options that fail a must-have
- Delete rows where every value matches
- Confirm one unit per row
- Mark unknown values explicitly
- Recheck each cell against its source
- View the chart on a phone
Questions about product comparison charts
What should a product comparison table include?
A product comparison table should include only options that pass your must-haves. Add the criteria that could change your decision, each with one unit and format. A short note on where each value came from keeps the table trustworthy.
How many products should a comparison chart show?
No single number of products suits every comparison chart or screen size. The practical limit is how many columns you can read without scrolling sideways. Filtering out options that fail a must-have keeps the count manageable.
Should products go in columns or rows?
Products go in columns when you compare a few options across many criteria. Put products in rows when the list is long and the criteria are few. Rows also make sorting by a single criterion, such as capacity, straightforward.
What is the difference between a feature matrix and a comparison chart?
A feature matrix is one type of comparison chart, built as a grid of options against features. Other comparison charts include weighted scorecards, option cards and pros-and-cons layouts. A matrix suits factual features, while the other formats handle scores or judgments.
Can I build a comparison chart in a spreadsheet?
Yes, a spreadsheet handles a comparison chart well for a personal shortlist. Freeze the header row and first column so labels stay visible while scrolling. Conditional formatting, a rule that colors cells automatically, can shade cells that differ.
Read next
-
 Car comparison clarity
-
 Aesthetic layout inspiration for lists
-
 Product comparison card design
-
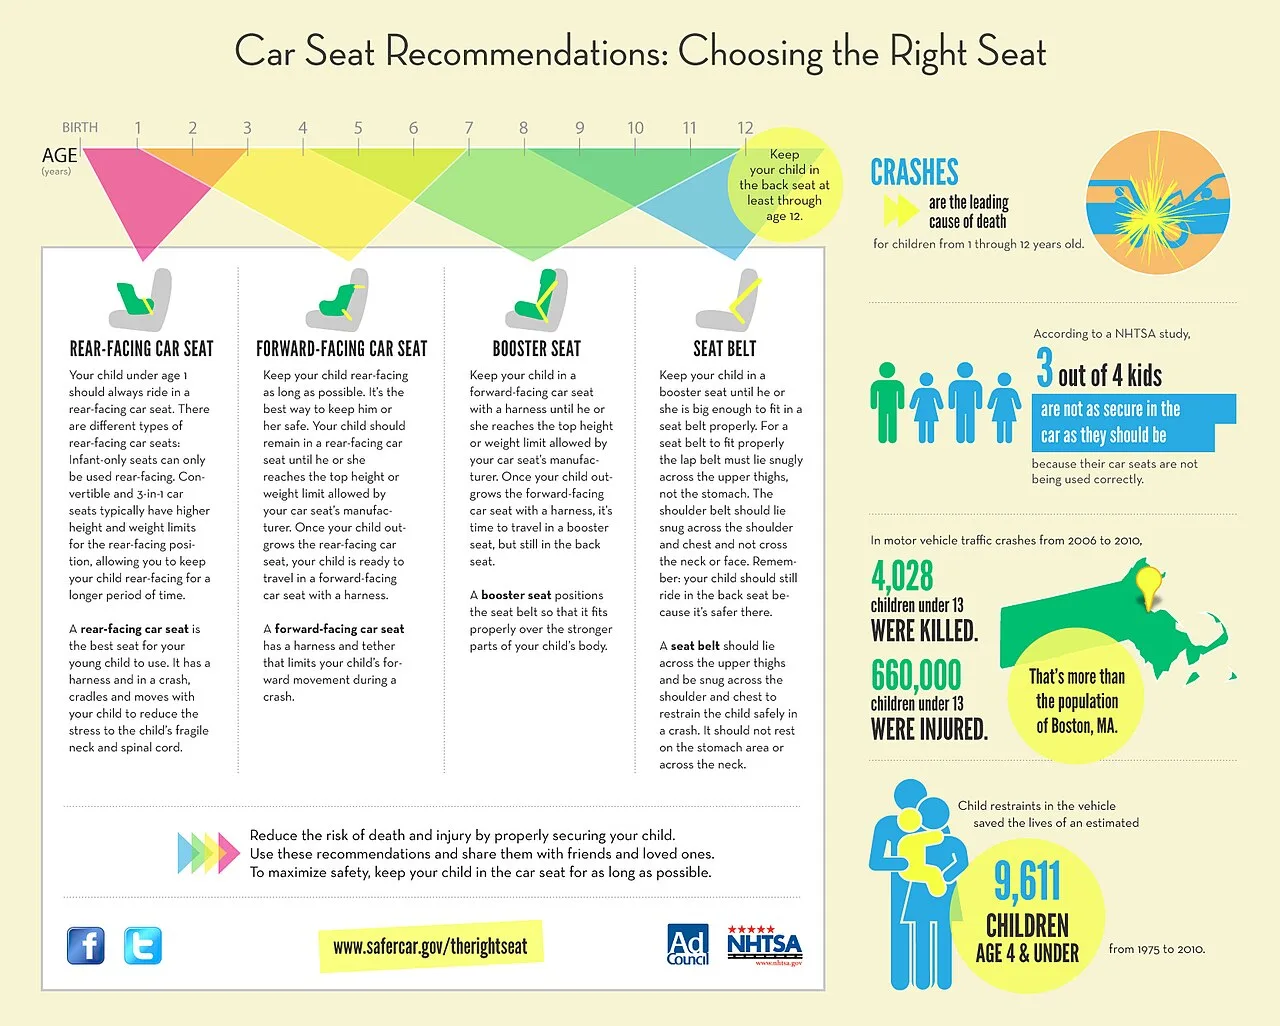 Car comparison infographic: visual layout for side-by-side listings
-
 Free comparison tools for beginners
-
 Basic visual comparison terms explained
-
 Side-by-side visual layout inspiration
-
 Vehicle depreciation curve comparison
-
 Skill building ideas and examples