Vehicle depreciation curve comparison
Learn how vehicle depreciation curves work, compare shapes by age and model year, and use a depreciation chart to judge resale value before you shortlist.
Contents
- What a depreciation curve shows
- Why the curve is steepest early
- How to build a car depreciation chart comparison
- Comparing models at the same age
- Model year and generation effects
- What drives the depreciation rate by age
- From curve to shortlist decision
- Mistakes to avoid in curve comparisons
- Questions about vehicle depreciation curves
- What does an average car depreciation curve look like?
- How do I compare vehicle depreciation curves for two models?
- Does the model year change the depreciation curve?
- How does depreciation affect resale value?
- Is a flatter depreciation curve always the better choice?
- What factors change the depreciation rate by age?
A vehicle depreciation curve shows how a car's value falls as it ages, and comparing curves tells you how fast different models lose value. The curve drops steeply in the early years, then flattens as the vehicle gets older. Reading the shape of each curve helps you estimate resale value and pick a shortlist you understand.
- The curve is steepest in the first years and flattens with age, so early years carry the largest loss.
- Compare curves side by side by model, model year and trim rather than trusting a single average.
- A depreciation chart turns the curve into numbers you can use for resale value estimates.
- The depreciation rate by age depends on the model, its condition, mileage and local demand.
- A flat curve near the end of its life still carries repair and reliability risk worth weighing.
What a depreciation curve shows
A vehicle depreciation curve plots vehicle value over time from the first sale onward. The line falls quickly at first and then levels off toward the end of the vehicle's life. Each point on the curve is an estimate of what the vehicle is worth at that age.
The depreciation curve is a model, not a rule, and it differs by model, trim and market. Two cars sold at the same price can follow very different curves because buyers value them differently as they age. Treat the curve as a guide for comparison, not a fixed schedule.
Reading the curve means watching the slope, which shows the depreciation rate by age. A steep early slope means a large loss in the first years, while a flatter line means value holds. Comparing slopes across models is the core of a vehicle depreciation curve comparison.
Why the curve is steepest early
A new vehicle loses a large share of its value the moment it leaves the seller and becomes used. The first owners absorb the steep part of the curve, and later owners buy into a flatter section. That is why the age at which you buy changes how much depreciation you carry.
The early drop reflects the shift from new to used status, not just wear. Buyers of used vehicles expect a lower price, and that expectation shapes the curve from the start. The curve then settles as the vehicle's identity as a used car becomes normal.
Later sections of the curve are flatter but not flat, because age and mileage keep eroding value. A vehicle near the bottom of its curve loses little in absolute value each year. Repair costs and reliability risk can become a larger part of the cost than depreciation itself.
How to build a car depreciation chart comparison
A car depreciation chart comparison places several curves on one set of axes so you can see differences at a glance. Put age or model year on one axis and estimated value on the other. Then plot each model you are considering as its own line.
Use the same starting point for every line so the comparison is fair. If one vehicle starts at a much higher price, compare the percentage retained rather than the raw amount. Label each curve with the model, trim and model year so you can tell them apart later.
The chart makes the trade-offs visible and supports a model comparison across the shortlist. You can see which vehicles hold value and which fall fast, then weigh that against price and running costs. Keep the source and assumptions next to the chart so the numbers stay honest.
- Choose the age or model year range you care about.
- Pick the models and trims to compare.
- Set the same starting value basis for each line.
- Plot estimated value at each age on the chart.
- Label every curve with model, trim and year.
- Note the assumptions behind each estimate.
Comparing models at the same age
Comparing vehicles at the same age shows how model choice shapes the curve. A model with strong demand as a used vehicle keeps more of its value than one with weak demand. The gap between the lines at any age is the value you gain or lose by choosing one model over another.
A model comparison should hold age and condition constant so the curve difference reflects the model itself. Trim level, engine and options change demand and therefore the curve. Include the trim in your comparison or the lines will mislead you.
Model year matters because a redesign or a new generation can reset demand. Curves from different model years are not directly comparable without noting the generation change. Split the comparison when the model changed significantly between years.
Model year and generation effects
Model year enters the depreciation curve through changes in design, equipment and buyer interest. A refreshed generation can lift demand and flatten the curve for that year. An older generation may fall faster once a newer one arrives.
Comparing a model year against a newer one of the same name can mislead if the design changed. Treat each generation as a separate curve and note where the change happened. This keeps the vehicle value over time estimate tied to a comparable vehicle.
Older model years sit further along the curve, where depreciation is slower in percentage terms. The absolute loss per year is smaller, but the vehicle is closer to the end of its useful life. Weigh that against the remaining resale value you expect.
What drives the depreciation rate by age
The depreciation rate by age depends on model demand, condition, mileage, equipment and local market conditions. No single average curve fits every vehicle, because these factors pull the line up or down. Use an average car depreciation curve only as a starting reference.
Mileage above what buyers expect for the age pushes the line down faster. Condition and service history can slow the fall for a well-kept vehicle. Equipment and trim change buyer interest and therefore the slope at each age.
Local demand shifts the curve without changing the vehicle, so a curve from one market may not fit another. That dependence is why the curve is an estimate rather than a fixed fact. Rebuild the curve with local listings when the market is different.
From curve to shortlist decision
A curve becomes useful when it sits beside the listing details of the vehicles you are weighing. Keep price, age, mileage and equipment side by side, then check each against its curve. Vehicles priced above their curve position carry more depreciation risk ahead.
Build the shortlist around the total cost of ownership, not the purchase price alone. Depreciation is one part, and running costs and repair risk are others. A flat curve late in life can still hide high repair costs that erode the advantage.
Revise the shortlist when the underlying assumptions change, such as mileage or condition. Document what you assumed so you can explain the choice later. A shortlist you understand is one where every line traces back to a curve you can point to.
| Curve signal | What it suggests | What to check |
|---|---|---|
| Steep early slope | Large loss in first years | Age at purchase and price gap |
| Flat middle section | Value holds with age | Demand and equipment level |
| Falling late section | Slow loss, near end of life | Repair and reliability risk |
| Curve above asking price | Listing priced high against curve | Mileage, condition, history |
Mistakes to avoid in curve comparisons
Comparing curves built on different assumptions is a frequent error that distorts the result. Match the value basis, age range and condition before you compare lines. Otherwise the chart shows the difference in assumptions rather than the difference in vehicles.
Ignoring trim and generation changes flattens real differences between similar-named models. Treat each generation and trim as its own curve. This keeps the model comparison tied to vehicles a buyer can actually find.
Treating the curve as a promise of future value is another error, because the curve is an estimate. Market conditions, condition and mileage can move the actual path away from the line. Use the curve to compare options, not to predict a precise price.
Questions about vehicle depreciation curves
What does an average car depreciation curve look like?
An average car depreciation curve falls steeply in the first years and then flattens as the vehicle ages. The exact shape varies by model, so treat the average as a reference point only. Build your own curve for the models on your shortlist.
How do I compare vehicle depreciation curves for two models?
To compare vehicle depreciation curves, plot both models on the same chart with the same starting basis and age range. Look at the gap between the lines at each age to see which holds value better. Note trim and generation differences before you draw a conclusion.
Does the model year change the depreciation curve?
Yes, the model year changes the depreciation curve because a new generation or refresh shifts demand. Each generation should be compared as its own curve. Mixing model years across a redesign can distort the comparison.
How does depreciation affect resale value?
Depreciation sets the path of resale value over time, with early years eroding it fastest. A flatter curve means more of the value remains when you sell. Check the curve position against the asking price to judge whether a listing is priced well.
Is a flatter depreciation curve always the better choice?
No, a flatter depreciation curve is not automatically better, because the vehicle may carry higher repair or running costs. Weigh depreciation against the full cost of ownership. A flat line late in life can hide risk that offsets the value held.
What factors change the depreciation rate by age?
Several factors change the depreciation rate by age, including model demand, mileage, condition, equipment and local market conditions. These pull the curve up or down and depend on the specific vehicle. Rebuild the curve with local listings when the market differs.
Read next
-
 Car comparison clarity
-
 Aesthetic layout inspiration for lists
-
 Product comparison card design
-
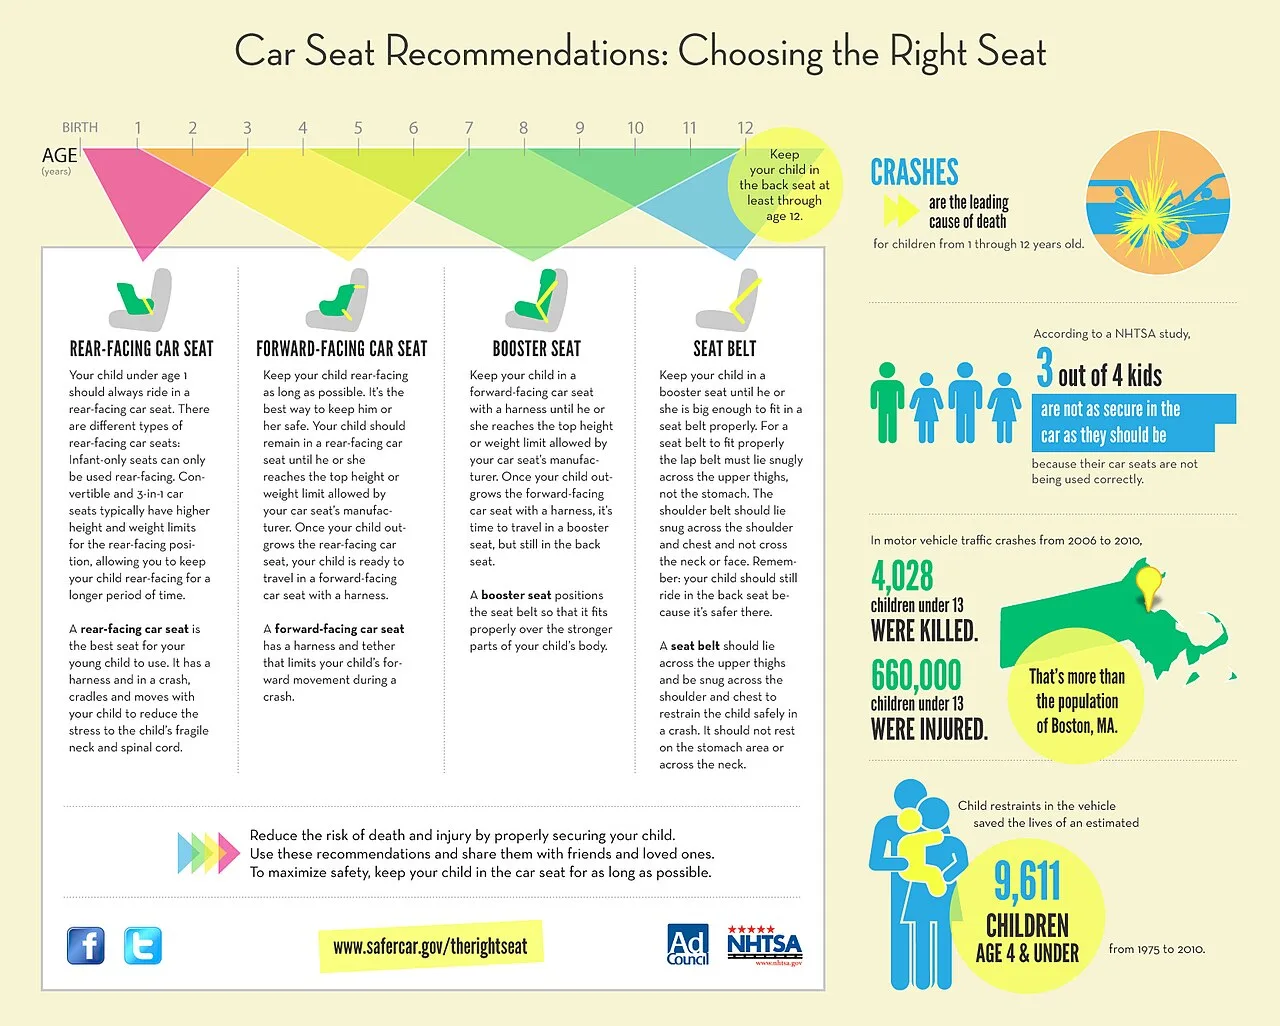 Car comparison infographic: visual layout for side-by-side listings
-
 Free comparison tools for beginners
-
 Basic visual comparison terms explained
-
 Side-by-side visual layout inspiration
-
 Skill building ideas and examples




